» Voronoi diagrams
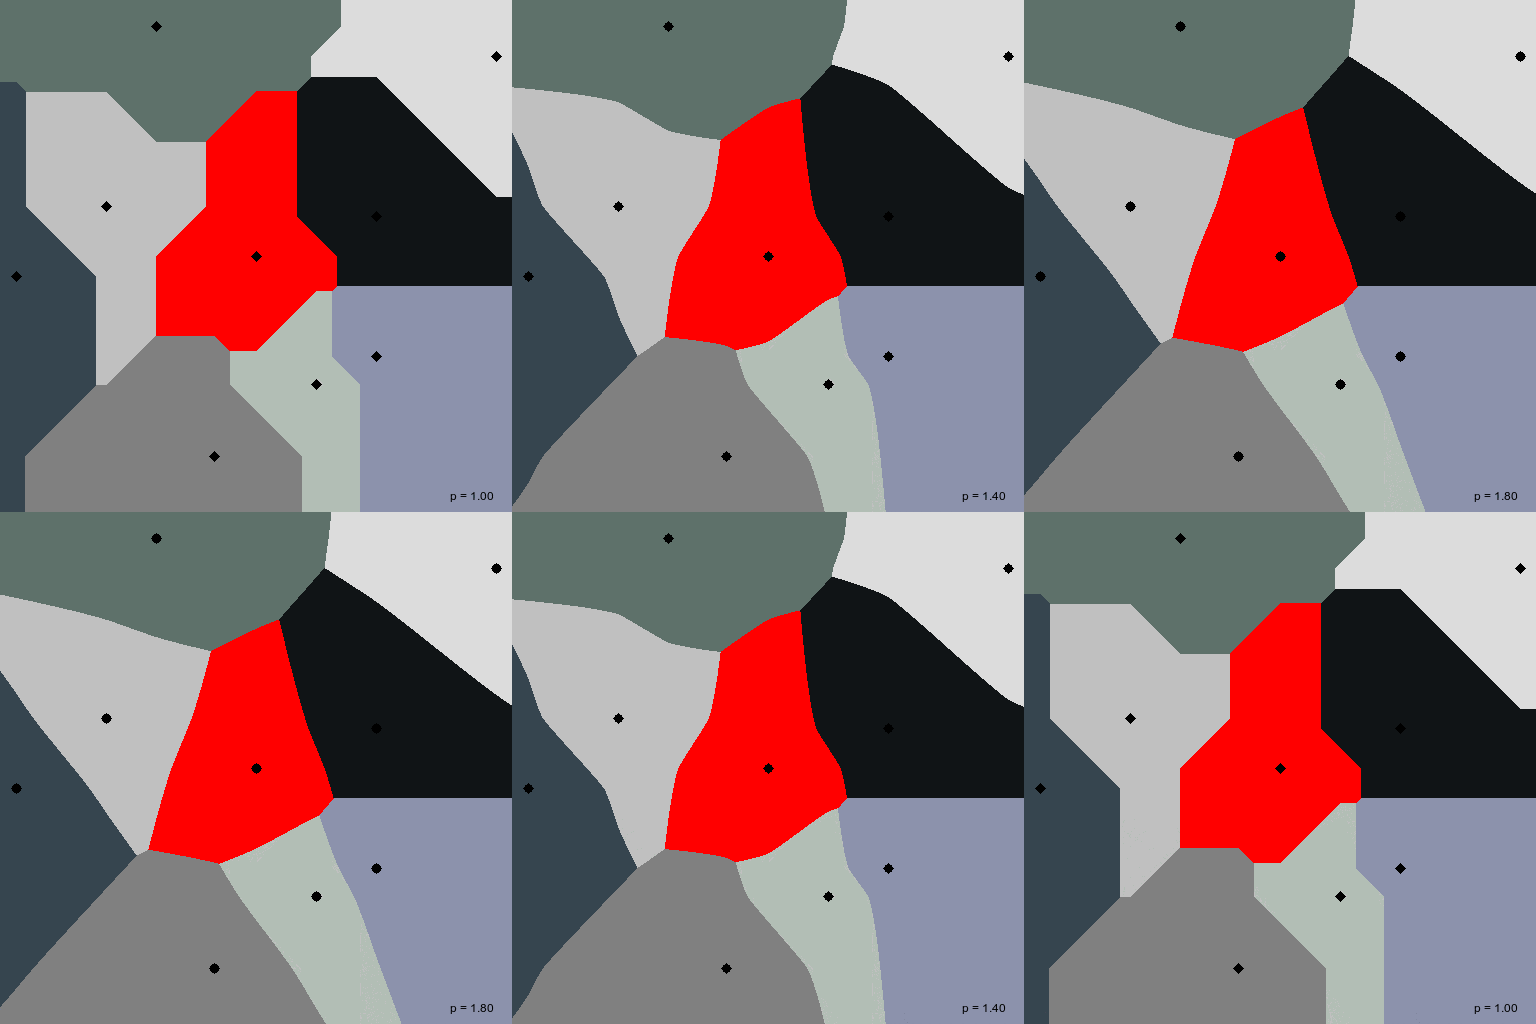
…an exploration of Voronoi diagrams as a visualization method for metrics in two dimensional spaces using C++.
Execute voronoi.sh to generate an animated GIF of the transition between a Voronoi diagram based on the Manhattan metric and one based on the Euclidean metric.
An animation of the unit sphere may be generated using unit_circle.sh.
Sources are freely available under the terms of the MIT license.
More information on the implementation as well as the theory behind it is available in German.
Example
